Exporting
Exporting requires a license; the 30-day trial includes it. Saving a workspace does not — it is never blocked.
Statistics as CSV
Section titled “Statistics as CSV”Export in the statistics panel offers two layouts, for the active file or — in the All files view — for every open file:
| Choice | What you get |
|---|---|
| This table | One row per population, with the statistic columns you have on screen |
| All parameters | One row per population and parameter, with every statistic — for marker sweeps |
Every row starts with File Name, Path, Gate Name, Type, X axis, Y axis,
Count, % of Total and % of Parent. Count and both percentages are always
included, even if you have hidden them on screen.
The Compensation column
Section titled “The Compensation column”The last column of every row, Compensation, records how that row’s file was
compensated, because a multi-file export can mix compensated and raw files and
nothing else in the file says which:
| Value | Meaning |
|---|---|
on |
Compensated with the file’s own acquisition matrix |
on* |
Compensated with a different matrix — edited, imported, computed from controls, or applied from another file |
off |
Not compensated: raw values |
mismatch |
Compensation is on, but the matrix names channels the file does not have |
These match the Comp, Comp* and Comp ⚠ badges in the file list — see
Compensation. A file whose statistics cannot be computed —
a mismatch file is one — is left out of the export, and the app tells you which:
“Exported … of … files. No statistics for: …”.
It is last so that a script reading the earlier columns by position keeps working.
Blank means “not counted”, not zero
Section titled “Blank means “not counted”, not zero”A population that cannot be counted is written with empty cells in the
This table layout, never as 0. A real zero and “could not be computed” are
different results, and an empty cell keeps them apart.
For an experiment rather than a single sample, batch analysis can also export a files × gates table.
How CSV files are encoded
Section titled “How CSV files are encoded”Every CSV the app writes — statistics, events, batch, dose-response and the compensation matrix — is UTF-8 with a byte-order mark (BOM).
The mark is what makes Excel open the file correctly. Without it, Excel on
Windows reads a CSV in the system’s legacy code page — Shift-JIS on Japanese
Windows, for example — and every non-ASCII character turns into garbage: a gate
name typed in Japanese, a marker name with a Greek letter, R² in a dose-response
fit. With the mark, Excel reads the file as UTF-8 and the names come through
intact.
Column headers are always in English, whatever language the interface is in, and numbers always use a full stop as the decimal separator. The files are data: a script or a colleague reads them the same way everywhere.
If you read the files in code, use an encoding that drops the mark:
- Python —
open(path, encoding="utf-8-sig"). pandas’read_csvalready handles it. - R —
read.csv(path, fileEncoding = "UTF-8-BOM").
Otherwise the first column’s header can come through as File Name, and a
lookup by name fails.
Event data as CSV
Section titled “Event data as CSV”Export in the toolbar:
| Choice | What you get |
|---|---|
| All Events (CSV) | Every event in the active file |
| A gate, by name | Only events inside that population — the gate and all its parents |
| Batch Export All Files | Every event of every open file, one CSV per file, into a folder you choose. Shown when more than one file is open. |
Per-gate event export is the route to another tool — hand the events for a population to R or Python without re-deriving the gate there.
Each file’s events are exported with its own compensation. A compensated channel is
labelled Comp-… (for example Comp-FITC-A), so a compensated column is never
mistaken for a raw one.
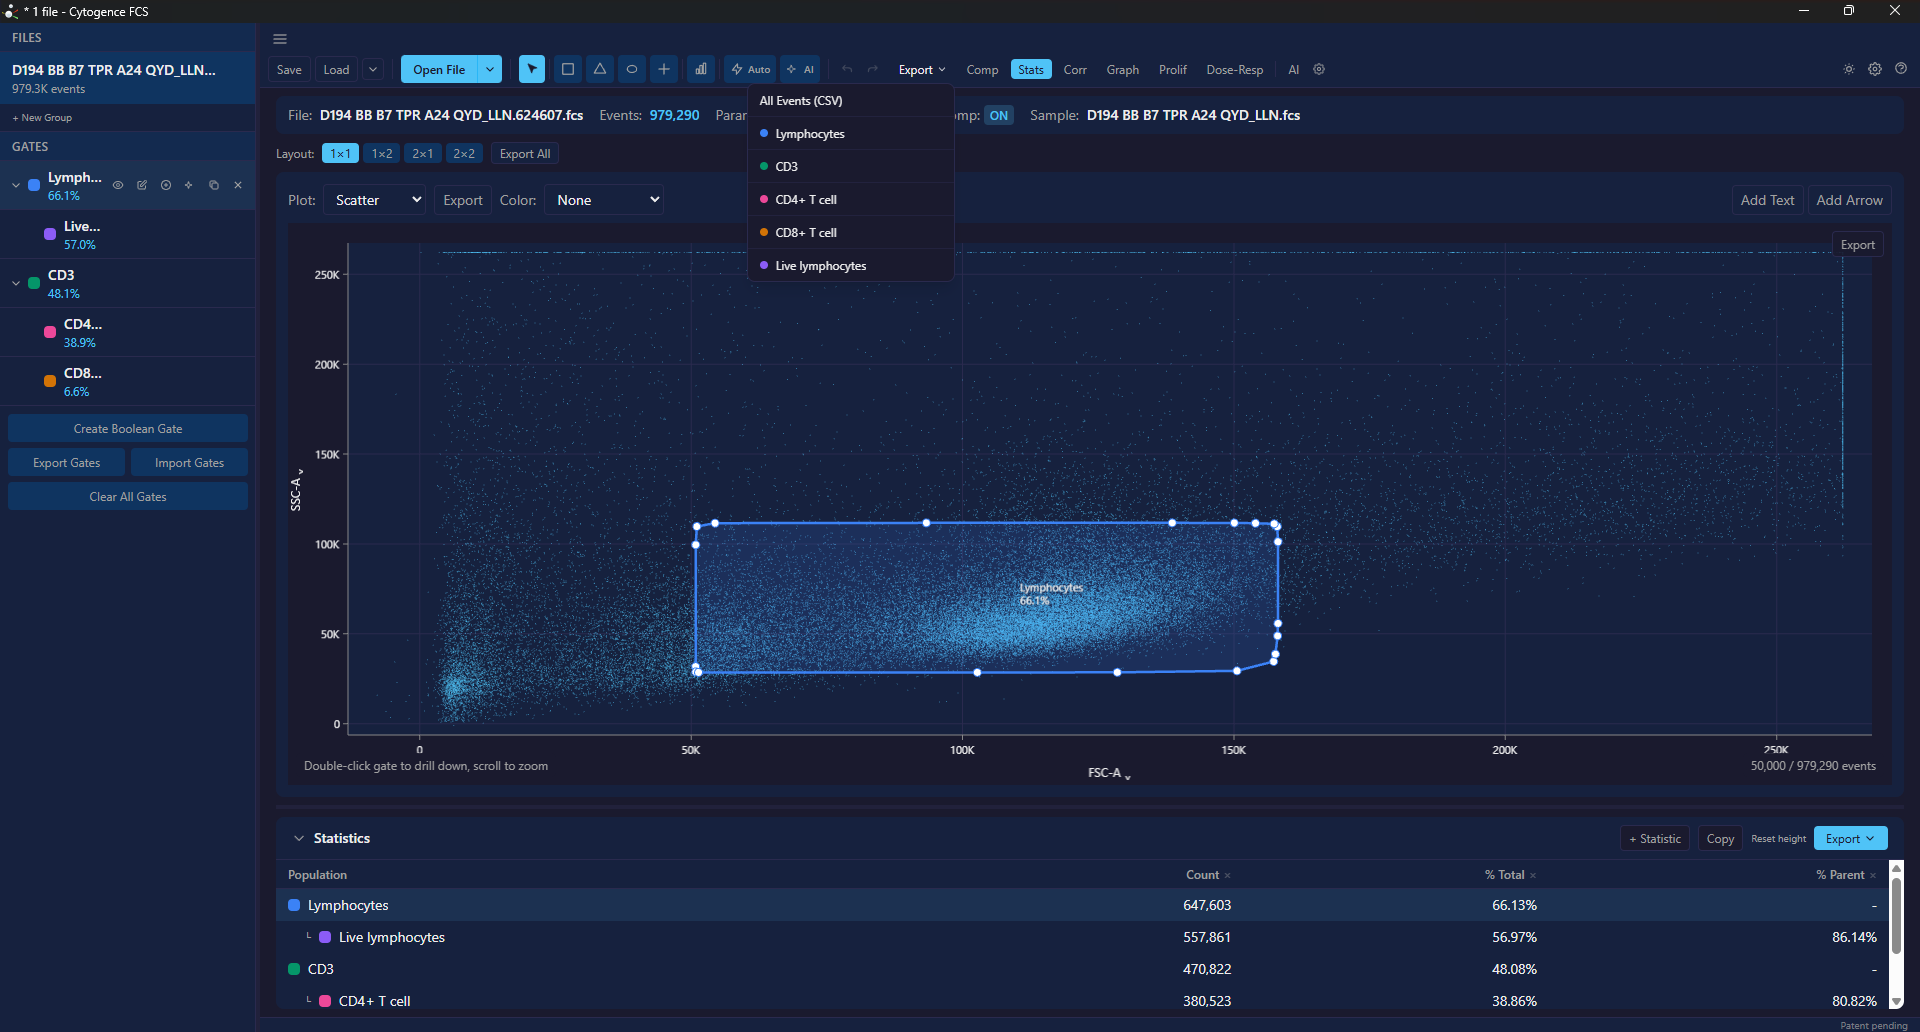
Each population is listed with the colour it carries in plots and in the gate list, so the population you are exporting is the one you meant.
Figures
Section titled “Figures”A plot’s Export menu offers Export as PNG, Export as SVG and Export as PDF. Before saving, Export Settings asks for the width, height, resolution — 72 (Screen), 150 (Draft) or 300 (Print) — and background (transparent, white or black). Preferences → Export Defaults sets the defaults.
Graph Builder charts are different: their Export SVG is a true vector drawing, editable element by element. Their Export PDF and Export PNG are images.
The compensation matrix
Section titled “The compensation matrix”Export in the compensation panel writes the spillover matrix as a CSV — a header row of channel names, then one row per channel. Do it, for the record.
- Export Gates in the gate list saves a Cytogence gate template (
.cgt), which Import Gates reads back — the way to reuse a strategy in another analysis. - Export Gating-ML writes the gate tree as ISAC Gating-ML 2.0, readable by FlowKit, Cytobank and FCS Express, with the compensation each gate was drawn in: the file’s own matrix, none, or — for an edited matrix — the matrix itself, written into the document.
- Import Gating-ML keeps each gate in the compensation it declares, asking before it switches the file’s compensation. A gate whose parent could not be imported is skipped and listed, never added as a top-level gate.
What makes a result reproducible
Section titled “What makes a result reproducible”A statistics table on its own does not record how it was produced. For a figure or number you may need to defend, export:
- The statistics — the numbers themselves, with the Compensation column.
- The compensation matrix — the transform applied to the data.
- The workspace — gates, hierarchy and each file’s compensation. See Workspaces.
- The AI audit trail, if the copilot was involved — which steps were proposed and which you approved.
- The AI-1 competence report, if AI-1 gated anything — including which populations it declined.
Points 4 and 5 are the ones people forget, and they are the ones a reviewer asking “how was this gated?” is actually asking about.